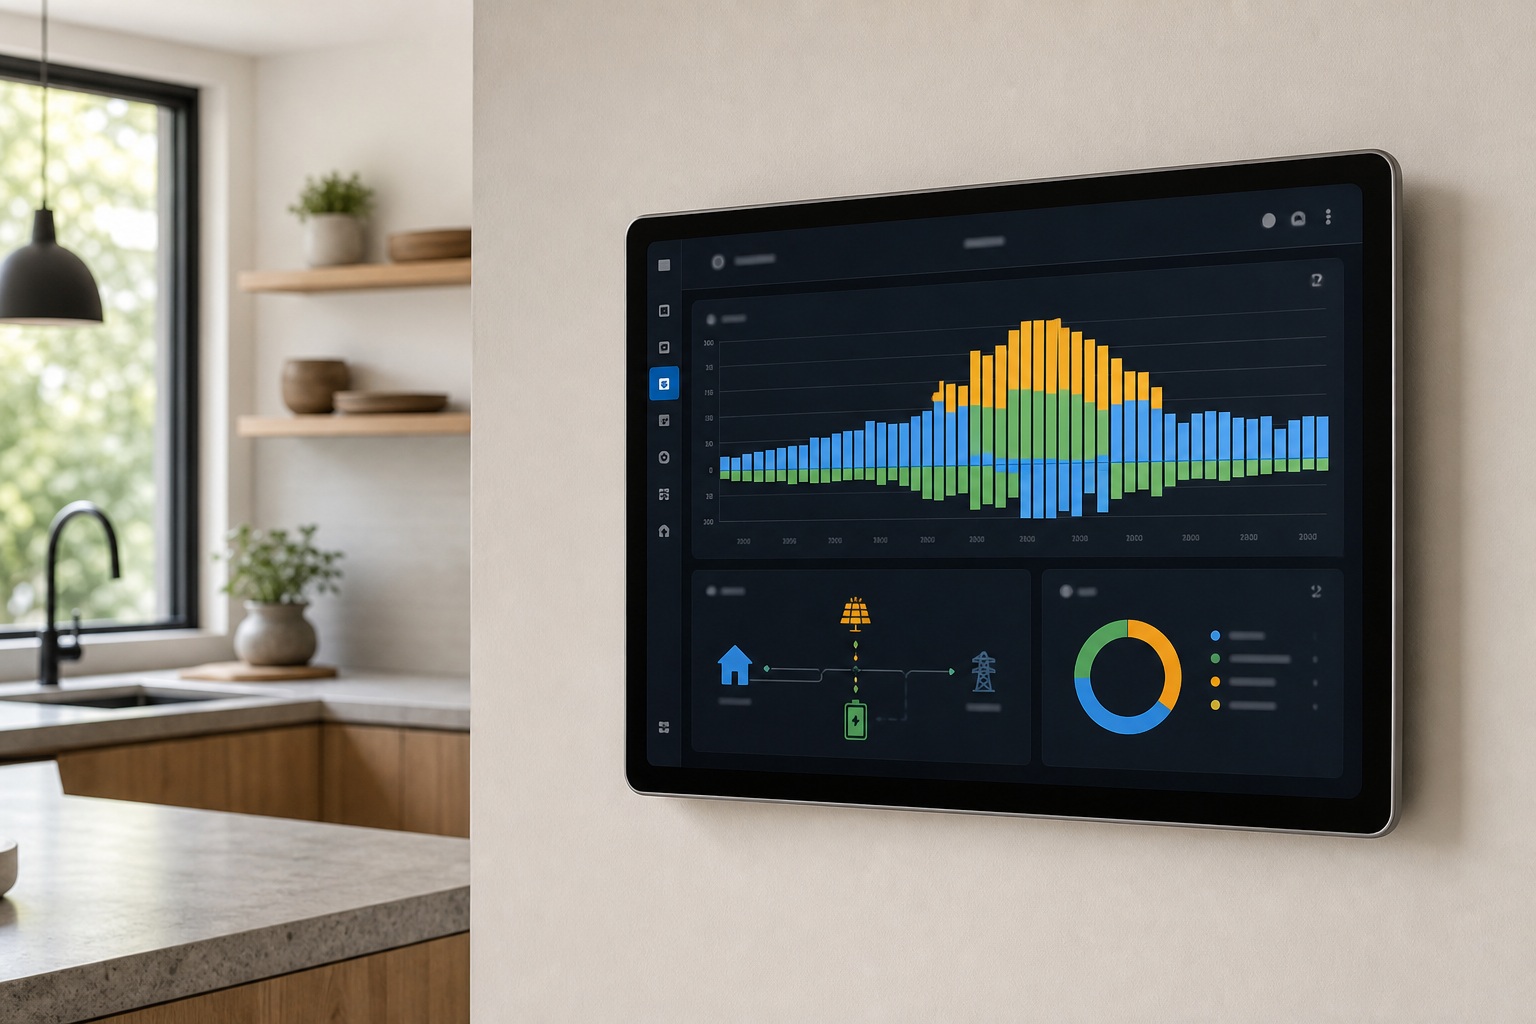
Your sensor won't show up in the dropdown, or your graphs stay blank. Almost every time, the cause is the same: you fed the dashboard power in watts instead of energy in kilowatt-hours (kWh).
A Home Assistant energy management setup is mostly a sensor problem, not a dashboard problem. The Energy Dashboard is built into Home Assistant, and switching it on takes a handful of clicks under Settings → Dashboards → Energy. What decides whether it works is whether each sensor you feed it reports accumulated energy in kWh, carrying the right device_class and state_class. Almost every "no data" or "my sensor won't show up in the dropdown" complaint traces back to feeding the dashboard power in watts instead of energy in kWh.
Get the sensors right and the dashboard fills itself in. Hourly, daily, weekly, and monthly graphs appear on their own within an hour or two. This guide covers grid, solar, battery, gas, water, and individual appliances, and it flags where the hardware differs between the US and Europe.
What the Energy Dashboard needs before you start
The Energy Dashboard is a built-in Home Assistant feature, added in version 2021.8, that tracks electricity, solar, battery, gas, and water over time, with cost and historical breakdowns. You don't install it: you configure which sensors feed it.
What is the Home Assistant Energy Dashboard? A built-in view that turns cumulative energy readings into long-term statistics: hour-by-hour through year-by-year graphs of consumption, production, self-sufficiency, and cost. It reads from Home Assistant's long-term statistics, not from live states, which means it shows history rather than a live power meter.
Two prerequisites cover the software side. First, you need Home Assistant Core 2021.8 or newer. Second, the Recorder integration must be active: it's on by default, and it stores the long-term statistics the dashboard draws from. Keep at least 30 days of history (purge_keep_days: 30 or more) so weekly and monthly comparisons stay meaningful. Beyond that, you need at least one sensor reporting energy in kWh. Everything else in this guide exists to produce that one sensor.
Energy vs. power: the distinction that decides everything
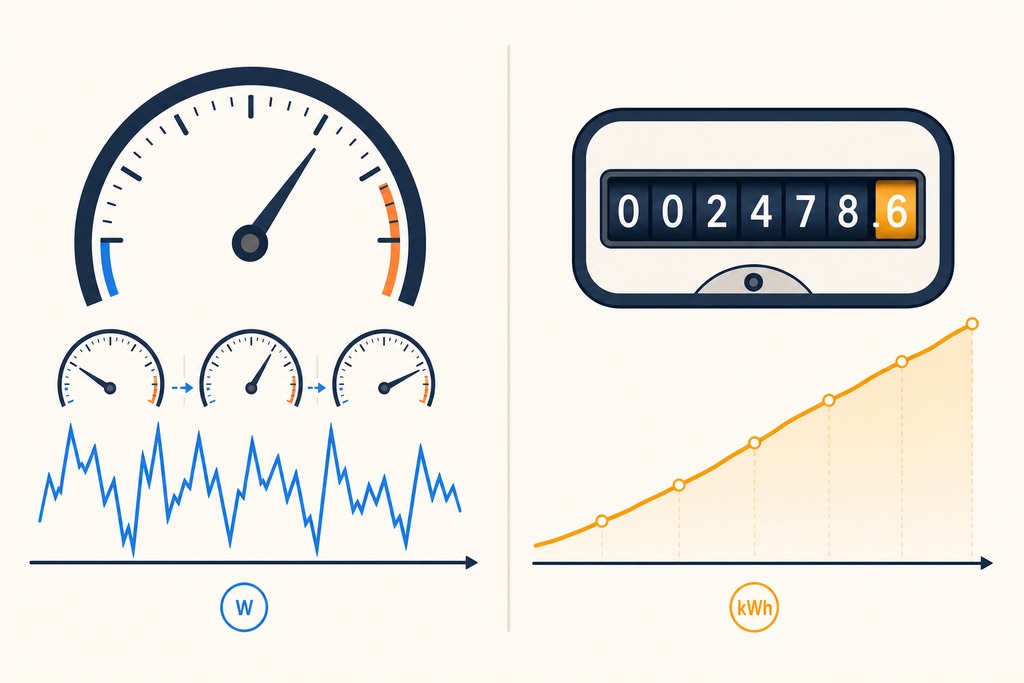
The dashboard accepts cumulative energy (kWh), a number that only climbs, and rejects instantaneous power (watts), which rises and falls minute to minute. Feed it a watt sensor and you get silence: the entity never even appears in the configuration dropdown, and nothing shows on the graphs.
Here's why. A solar inverter reporting 3,200 W tells you the rate of generation right now. The dashboard needs the total kWh produced since the sensor started counting: a running odometer, not a speedometer. A watt reading gives you no way to know how much energy passed in an hour, because the value could have sat at 3,200 W for five minutes and near zero for the rest. Home Assistant won't guess. A sensor that already accumulates kWh drops straight in: most inverter, smart-meter, and metering-plug integrations do this. A watt-only sensor has to be converted first, which is a separate step covered below.
Required sensor attributes by energy type
A sensor becomes selectable in the Energy configuration only when three attributes match what that source expects. Check them under Developer Tools → States.
| Energy source | device_class |
state_class |
Typical unit |
|---|---|---|---|
| Grid consumption (import) | energy |
total_increasing |
kWh |
| Return to grid (export) | energy |
total_increasing |
kWh |
| Solar production | energy |
total_increasing |
kWh |
| Battery charging (in) | energy |
total_increasing |
kWh |
| Battery discharging (out) | energy |
total_increasing |
kWh |
| Battery state of charge | battery |
measurement |
% |
| Gas | gas |
total_increasing |
m³, ft³ (or kWh) |
| Water | water |
total_increasing |
m³, ft³, L, gal |
The state_class is where people trip up. Use total_increasing for a meter that only counts up and occasionally resets to zero: a dedicated import, export, production, charge, or discharge meter. Use total only for a bidirectional signed sensor that genuinely rises and falls, like one "net" value that goes negative when you export. The dashboard would rather see the split, a separate import meter and a separate export meter, than one signed number, for reasons the configuration step comes back to.
Choosing your data source and hardware
Will this smart-home device last?
Score the evidence you can verify, from 0 (poor) to 5 (strong). This is a buying check, not a promise: a useful device should still do its basic job if an app, subscription, or vendor disappears.
Livability score: 60 / 100
Verdict: Caution
Main risks: local control, open standard, firmware-update policy, cloud independence, replaceability, and data privacy all need a closer look.
Weights favor the things that keep a device useful after the sales pitch fades. See how we test for the method behind the checks.
Pick hardware by what you want to measure and where you live, then check one thing: does it already output kWh? If your inverter, battery, or smart-meter integration exposes import, export, production, or charge/discharge in kWh, you don't need to buy anything else.
| What you're measuring | Recommended hardware or integration | Reports kWh directly? / notes |
|---|---|---|
| Whole-home (US) | Emporia Vue 2, IoTaWatt, Shelly Pro 3EM (CT clamps on the mains) | Yes: export kWh; panel install belongs to an electrician |
| Whole-home (Europe) | P1 smart-meter reader: HomeWizard P1, Slimmelezer, or a DSMR reader | Yes: import and export split at the meter |
| Circuit or device level | Shelly EM, Shelly Plus Plug, TP-Link Kasa, Zigbee metering plugs | Usually: most report kWh; a few report watts only |
| Solar | Native inverter integration: SolarEdge, Enphase, Fronius, SMA, Huawei, Growatt | Yes: usually production/import/export in kWh; no extra hardware |
| Battery | Tesla Powerwall, Victron, Enphase, or the inverter's own integration | Yes: usually charge/discharge kWh plus state of charge |
| Gas | Smart gas meter via P1/DSMR, or a pulse counter | Yes: cumulative m³ or ft³ |
| Water | Water meter pulse counter or a WMBus reader | Yes: cumulative litres or m³ |
IoTaWatt's 14 inputs make it a strong pick when you want many circuits monitored at once. CT clamps read to roughly ±1–2% accuracy, close enough that the Energy Dashboard's daily and monthly totals track your utility bill within a small margin: calibrate against your meter reading once and it holds.
Add the integration and confirm the entities
Add the hardware integration first, then verify the entities before you touch the dashboard. This order saves you from configuring against a sensor that isn't updating.
- Open Settings → Devices & Services and select Add integration.
- Add the integration for your meter, inverter, smart plug, ESPHome device, or utility, and complete its setup.
- Open Developer Tools → States and search for the new entities. Confirm the value is present and that it climbs over a few minutes for cumulative sensors.
- In the same view, check the attributes read
device_class: energy,state_class: total_increasing, and a unit of kWh. If any is missing, the sensor won't be selectable yet. - Set the update interval to 30–60 seconds. Polling every few seconds bloats the Recorder database and adds nothing the dashboard can use, since statistics roll up hourly.
Convert power-only sensors to energy
Only needed when a device reports watts and nothing else. Create an Integral helper (Riemann sum) to turn watts into accumulated kWh, then feed the result to the dashboard.
- Go to Settings → Devices & Services → Helpers → Create Helper → Integral.
- Choose the power sensor as the source (for example,
sensor.washing_machine_power). - Set metric prefix
k, time unit hours, and integration methodleft. Theleftmethod suits loads that switch on and off abruptly and hold steady: a washing machine, a kettle. Use trapezoidal for smoothly varying, frequently sampled power. - Save. The new sensor accumulates kWh and can be added to the dashboard.
The YAML equivalent, producing a "Washing Machine Energy" sensor:
sensor:
  - platform: integration
    source: sensor.washing_machine_power
    name: Washing Machine Energy
    unit_prefix: k
    unit_time: h
    method: left
    round: 3
The result must end up with device_class: energy, state_class: total_increasing, and unit_of_measurement: kWh: only then is it selectable. Do not paste total_increasing onto a raw watt sensor to force it through; that mislabels power as energy and produces nonsense totals.
Configure the Energy Dashboard
Open Settings → Dashboards → Energy and add sources section by section. Each field only lists sensors carrying the matching attributes from the table above.
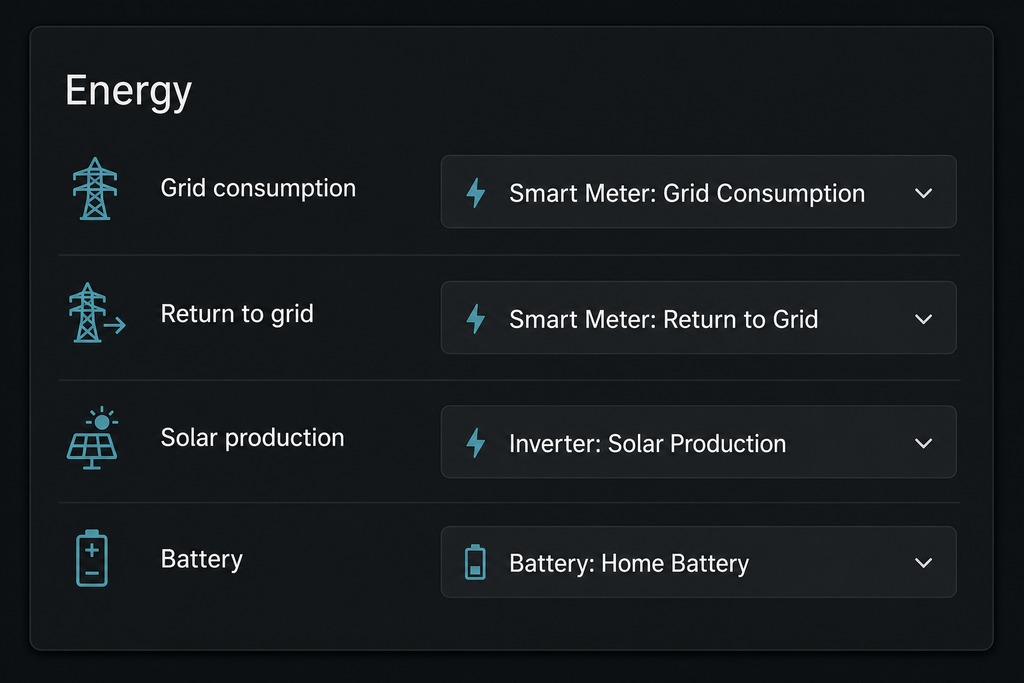
- Electricity grid. Under Grid consumption, add your import (kWh) sensor. Under Return to grid, add your export (kWh) sensor. If you only have one signed "net" sensor that goes negative when exporting, split it first with two template sensors or the Utility Meter integration: the dashboard handles a single net value poorly.
- Solar production. Add your production sensor. With multiple inverters or strings, add each one; Home Assistant sums them.
- Home battery storage. Add energy going into the battery (charging) and energy coming out (discharging) as two separate cumulative sensors.
- Gas. Add the gas source. If it reports volume (m³ or ft³), Home Assistant prompts for the calorific value so it can convert to kWh for cost.
- Water. Add the water source (m³, ft³, litres, or gallons).
- Individual devices. This is a separate section, not part of the grid/solar/battery setup. Add each appliance's kWh sensor. If a metering plug sits on a circuit that a whole-home monitor also measures, set the upstream device relationship so the same energy isn't counted twice.
Set up cost and tariff tracking
Attach a price to each source and the dashboard turns kWh into money. Click the price icon next to a grid consumption or return-to-grid entity and pick one of three models.
| Pricing model | When to use it | How to configure / example |
|---|---|---|
| None | You want kWh only, not cost | Leave the price blank |
| Fixed price + standing charge | Flat-rate tariff | Enter a static rate per kWh (e.g. $0.15) and add a fixed daily standing charge |
| Entity-based dynamic price | Time-of-use or wholesale tariff | Link a price entity from Amber Electric, Tibber, Nord Pool, Octopus, or ENTSO-E; Home Assistant multiplies each hour's usage by that hour's price |
For export, set the feed-in compensation separately under Return to grid: a fixed rate (e.g. $0.05/kWh) or a dynamic entity if your provider pays a variable export price. Those prices are illustrative; enter your own tariff and check the live rate with your supplier, since dynamic prices change hourly.
Who should not do this (or should skip parts)
Some of this belongs to a professional, and some of it you can skip entirely.
- Do not open the electrical panel to fit CT clamps yourself. Clamping the mains busbars is an electrician's job, not a software tutorial's. The Home Assistant side only begins once the monitor is safely installed.
- Do not put an ordinary metering smart plug on an EV charger, heat pump, or electric dryer. A hard-wired or high-load appliance draws far more current than a plug-in socket is rated for. Check the plug's voltage, current, and load rating first, and use a hard-wired relay or CT monitor for anything heavy.
- Do not buy extra hardware you already have. If your inverter, battery, or P1 meter integration exposes kWh for import, export, production, or charge/discharge, you have exactly what the dashboard needs. Adding a second monitor just risks double-counting.
- Do not build the whole setup around one signed net sensor, and do not poll sensors every few seconds hoping for smoother graphs: neither helps, and the fast polling harms the database.
What the dashboard shows once data builds up
Give it one to two hours after setup — the dashboard needs at least two hourly data points before any graph draws. A blank screen right after configuration is normal, not a fault.
Once data accumulates, you get usage broken down by hour, day, week, month, and year; a sources view splitting grid, solar, and battery; a self-sufficiency figure showing how much of your consumption came from your own generation; devices ranked by consumption; and cost comparisons against previous periods. The individual-devices ranking is where the metering plugs earn their place, surfacing which appliance quietly dominates your bill.
Troubleshooting common problems
Match the symptom to its cause. Developer Tools → States and Developer Tools → Statistics are the two diagnostic screens you'll live in.
| Symptom | Likely cause | Fix |
|---|---|---|
| No data / blank graphs | Just set up; needs 1–2 hours and two data points | Wait; confirm the sensor value is climbing in Developer Tools → States |
| Sensor missing from the dropdown | Wrong or absent device_class, state_class, or unit |
Set device_class: energy, state_class: total_increasing, unit kWh |
| Watt sensor added, still nothing | It reports power, not energy | Convert it with an Integral helper, then add the result |
| Negative or spiky values | A meter reset dropped a total_increasing sensor to zero |
Home Assistant normally absorbs resets; for a genuinely signed sensor use state_class: total |
| Gaps in the graph | Recorder purged history too soon | Raise purge_keep_days to 30 or more |
| Corrupted long-term statistics | Unit or class changed after data already existed | Developer Tools → Statistics → fix or delete the bad statistic |
Going further: automations, visuals, forecasting
Once the basics report cleanly, these add-ons build on top — none is required, and none replaces the Energy Dashboard's historical statistics.
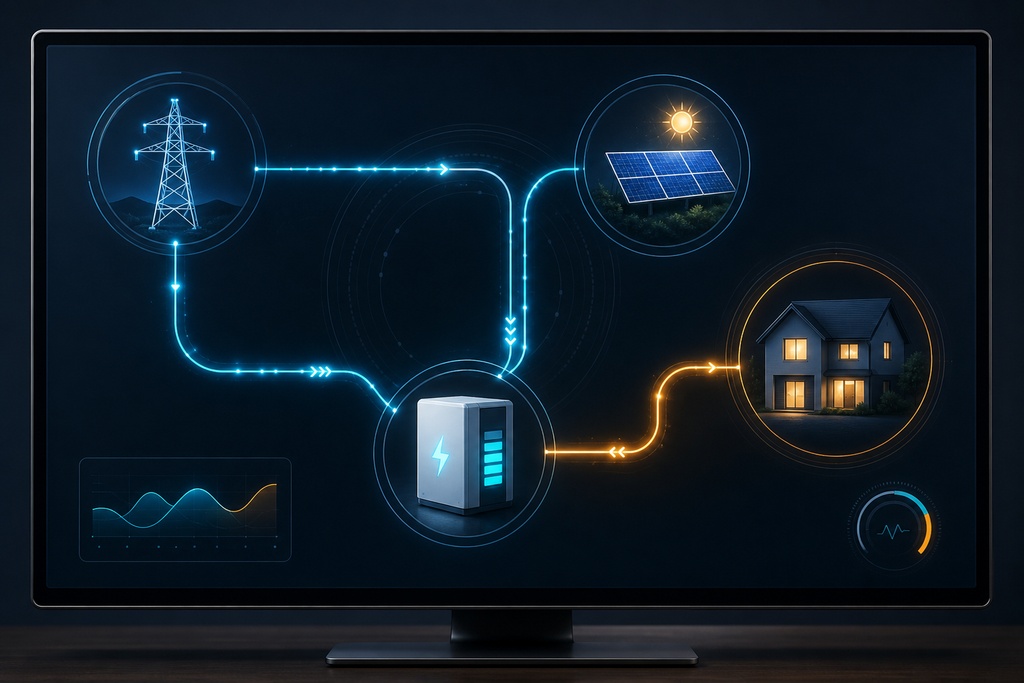
- Power Flow Card Plus (and the Sankey Chart card) draws a live energy-flow diagram — grid, solar, battery, home. This is a real-time view, a different thing from the dashboard's long-term statistics.
- Forecast.Solar (free) or Solcast predicts your solar production so the dashboard can show expected generation.
- EMHASS optimizes when to run loads and charge the battery against dynamic prices and forecasts.
- Automations to run the dishwasher or EV charger off-peak, or to charge the battery when solar output exceeds consumption.
- A high-usage alert that notifies you when power passes a threshold — for example, above 5 kW.
FAQ
Can I use a smart plug that only measures watts?
Not directly — the dashboard rejects watt sensors. Convert the plug's power reading to kWh with an Integral (Riemann sum) helper, set to metric prefix k, hours, and the left method. Feed the resulting kWh sensor to the dashboard.
Do I need extra hardware if I already have a solar inverter integration?
Usually not. Native inverter integrations for SolarEdge, Enphase, Fronius, Huawei, and Growatt typically expose production, grid import, and grid export in kWh already. Check Developer Tools → States for those entities before buying a separate monitor.
Why won't my sensor appear in the Energy configuration dropdown?
It is missing one of the three required attributes. The dashboard only lists sensors with device_class: energy, state_class: total_increasing, and a unit of kWh (or Wh). Confirm all three under Developer Tools → States, then re-open the configuration.
How long before the Energy Dashboard shows data?
One to two hours. The dashboard reads from long-term statistics, which roll up hourly and need at least two data points to plot anything. An empty dashboard immediately after setup is expected, not broken.
Can one net meter sensor cover both import and export?
Poorly. A single signed sensor that goes negative on export doesn't map cleanly to the dashboard's separate consumption and return fields. Split it into two cumulative sensors using template sensors or the Utility Meter integration, then add each to its own field.
References
- Home Assistant — Energy documentation (home-assistant.io/docs/energy/)
- Home Assistant — Integration/Riemann sum integral (home-assistant.io/integrations/integration/)
- Home Assistant — Individual devices (home-assistant.io/docs/energy/individual-devices/)
- Home Assistant — Recorder integration (home-assistant.io/integrations/recorder/)